Feasible quantification of MS tissue damage may be at hand
By Daniel Ontaneda, MD, MSc; Kunio Nakamura, PhD; and Mark Griswold, PhD
Cleveland Clinic is a non-profit academic medical center. Advertising on our site helps support our mission. We do not endorse non-Cleveland Clinic products or services. Policy
Although conventional MRI is an adequate tool for measuring focal inflammatory lesions in multiple sclerosis (MS), there is currently no validated method for specifically measuring demyelination and neurodegeneration in MS. One of the most important obstacles to developing therapies for progressive MS — and a significant unmet need in MS management — is the lack of specificity of conventional MRI to varying types and severity of tissue pathology in MS.
To that end, Cleveland Clinic’s Mellen Center for Multiple Sclerosis Treatment and Research has collaborated with Case Western Reserve University in the application of a revolutionary technology known as magnetic resonance fingerprinting (MRF) to quantitatively assess brain changes in MS. We recently reported findings from the first study applying MRF in patients with MS. After a brief review of MRF, this article shares key findings from that study and looks ahead to next steps in our group’s exploration of this technology’s compelling potential in MS management.
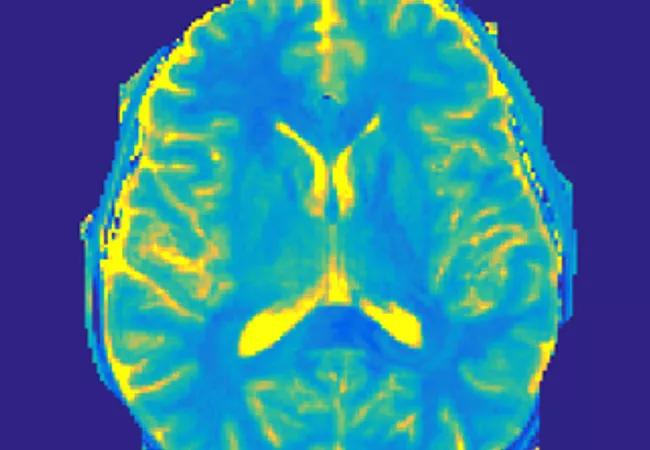
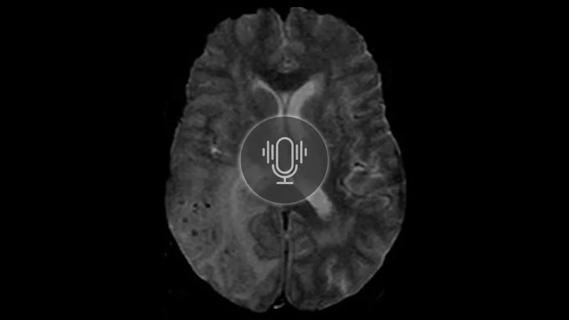
MRF has emerged as an alternate imaging method that can successfully address problems associated with conventional and advanced imaging modalities.1 An example MRF image appears at the top of this post. This technology enables the noninvasive quantification of multiple properties of tissue simultaneously through a novel approach to data acquisition, post-processing and visualization.2 Instead of acquiring data by serial implementation of different sequences, MRF uses a randomized acquisition with varying values for image parameters:
Data acquisition is conducted with a highly undersampled variable density spiral k-space trajectory. The result of the acquisition is a set of time-resolved images in which the time course for each pixel reflects its underlying tissue properties. A dictionary is created by simulating the signal time courses that could appear in the data based on the pulse sequence used and ranges of T1 and T2 based on physiological limits. Each pixel is then matched to find the dictionary entry that most resembles its characteristics, resulting in a map of the tissue properties for each pixel. This pattern-recognition approach of data analysis makes MRF a robust quantitative imaging technique with high tolerance to motion or artifacts.
Unlike with other imaging methods, the data processing in MRF is specialized to provide direct quantitative estimates of tissue properties of interest. MRF increases the sensitivity, specificity and efficiency of an MR study and thus may lead to new diagnostic testing methodologies. MRF may provide potential biomarkers for disease progression in MS as well as quantitative metrics of drug efficacy. In particular, MRF may be sensitive to molecular-level changes in myelin and neural tissue states.
The new technology offers advantages over conventional MRI in a variety of areas:
At the 2016 annual meetings of the American Academy of Neurology and the International Society for Magnetic Resonance in Medicine, our research team presented results from the first MRF study applied in patients with MS.3 We conducted a cross-sectional study to investigate whether MRF detects differences in normal-appearing white matter (NAWM) and normal-appearing gray matter (NAGM) between MS subjects and healthy controls as well as between patients with relapsing-remitting (RR) and secondary progressive (SP) MS (Figure 1). We also sought to understand the clinical relevance of MRF by measuring correlation of MRF findings with clinical disability.
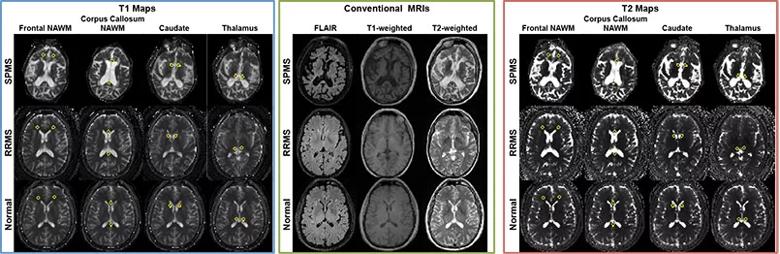
Figure 1. MRF-based T1 maps (left), conventional MRIs (middle) and MRF-based T2 maps (right) from patients with secondary progressive MS (SPMS, top rows), patients with relapsing-remitting MS (RRMS, middle rows) and healthy controls (bottom rows).
The study’s 55 subjects consisted of the following:
All subjects had been followed for 12 years in a longitudinal study and were scanned at 3T (Trio™, Siemens Medical Solutions, Erlangen, Germany) under written informed consent in an IRB-approved protocol. Subjects were scanned with a fast imaging with steady-state precession (FISP)-based MRF sequence. Data were reconstructed and processed offline in MATLAB (The Mathworks, Natick, Massachusetts). A dictionary with 47,049 elements (T1 range, 20-5,000 ms; T2 range, 10-500 ms) was used for pattern matching to generate quantitative T1, T2 and spin density maps.
The study’s key results included the following:
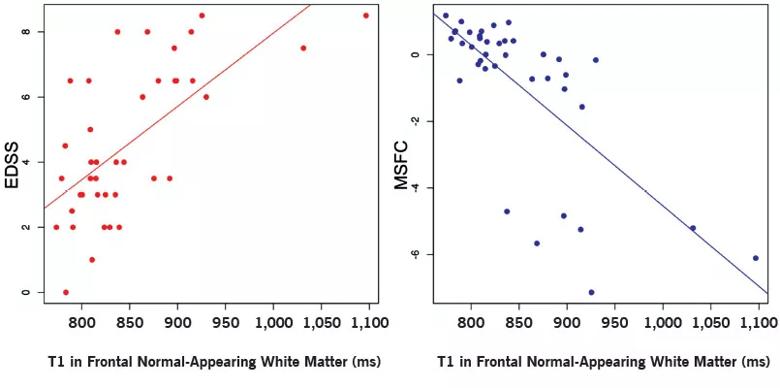
Figure 2. Scatter plots showing correlation of T1 values in frontal normal-appearing white matter with Expanded Disability Status Scale (EDSS) score and MS Functional Composite (MSFC) score. Spearman rank correlations were 0.612 for the EDSS and –0.697 for the MSFC.
Our findings show that MRF provides simultaneously acquired and intrinsically registered maps of multiple relaxation parameters. In agreement with previous T1-mapping techniques, we also found increased T1 in normal-appearing structures. T2 was increased in certain normal-appearing regions, similar to prior evidence that showed changes in NAWM but not in deep gray matter structures.
In addition to demonstrating differences between healthy controls and patients with MS, MRF distinguished the clinical course of disease even in this small sample size. This indicates a high sensitivity for detecting underlying nonlesional changes in MS and suggests that MRF may provide a window into the pathophysiology of the disease. Significant correlations with the MSFC and EDSS scores likewise suggest that MRF measures capture a clinically meaningful change in normal-appearing tissue.
We also have examined potential correlations between MRF and pathology findings through Cleveland Clinic’s MS postmortem program using imaging followed by rapid autopsy.
In this preliminary study (data in preparation for presentation), we imaged four MS cadavers on a 3T Trio scanner using conventional MRI and MRF. On conventional FLAIR MRI, all cases had T2-hyperintense and T1-hypointense lesions. When the brain and spinal cord were removed after scanning, macroscopic evaluation of fixed brain slices revealed that two brains contained no white matter plaques and two brains had white matter lesions. We processed the MRI and MRF data as described for lesional analysis, segmented T2 and T1 lesions, and obtained median MRF-based spin density, T1 and T2 values for each brain. The median values in the two groups showed an interesting trend in T1 and T2 values in T1 lesions (Figure 3).
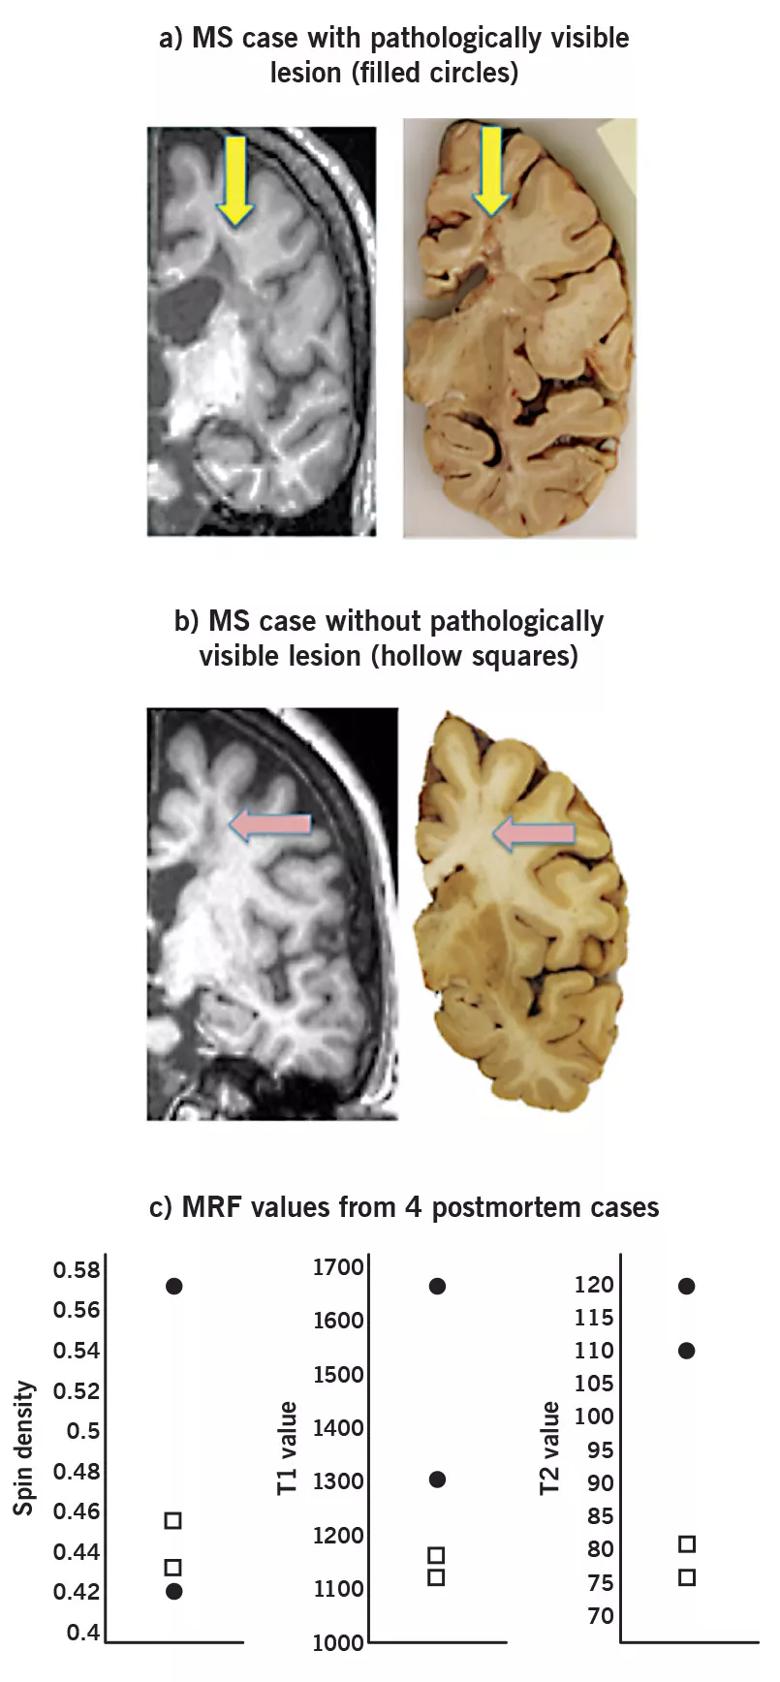
Figure 3. Preliminary results from four postmortem brains showing (a) two MS subjects with macroscopically visible white matter plaques (b) and two MS subjects without such plaques. The plots show the median value within T1 hypointense lesions from MRF imaging. Each marker indicates a measurement from a single brain, with filled circles indicating MS subjects with pathologically visible plaques and hollow squares indicating MS subjects without visible plaques.
In light of these findings, quantitative MRF measures seem to hold promise for differentiating T1 lesions into pathologically identified lesions.
We are currently conducting a longitudinal study using MRF measures focusing on the thalamus in MS. This study will help determine the sensitivity of MRF over time as well as provide improved image resolution. MRF for use at 7T scanning is now under development as well. We also hope to implement an MRF sequence, known as MRF exchange (MRF-X), that takes chemical exchange effects into account and could have significant sensitivity to myelin content.4
MRF represents a significant advance in radiology. In MS we expect to identify a marker of disease that can be used as a diagnostic test and as a biomarker of disease severity. Several features — fast acquisition, low variability between scanners and robustness to motion — make MRF an ideal potential outcome measure in phase 2 clinical trials.
Dr. Ontaneda is a staff neurologist in Cleveland Clinic’s Mellen Center for Multiple Sclerosis Treatment and Research.
Dr. Nakamura is a project scientist in the Department of Biomedical Engineering in Cleveland Clinic Lerner Research Institute.
Dr. Griswold is a professor in the Department of Radiology at Case Western Reserve University School of Medicine, Cleveland.

Large cohort study suggests need for routine sleep screening as part of neurological care

Early experience with the agents confirms findings from clinical trials

Determining the right dose and injecting in the right muscle can be challenging
ENRICH trial marks a likely new era in ICH management
Study combines intracranial electrophysiology and SPECT to elucidate the role of hypoperfusion
New research sheds light on a potentially devastating condition that is reversible when properly managed

Testing options and therapies are expanding for this poorly understood sleep disorder

Real-world claims data and tissue culture studies set the stage for randomized clinical testing