Locations:

Automated diagnosis, risk stratification and treatment assessment are feasible
By Sunil K. Srivastava, MD; Jordan Deaner, MD; Kimberly Baynes, MSN, RN; Cindy Chen, BS; Careen Y. Lowder, MD, PhD; Justis P. Ehlers, MD; Sumit Sharma, MD
Advertisement
Cleveland Clinic is a non-profit academic medical center. Advertising on our site helps support our mission. We do not endorse non-Cleveland Clinic products or services. Policy
Uveitis is a disease characterized by inflammation in the eye. Severe loss of vision can occur in up to 33% of uveitis cases due to structural changes and complications of uveitis, such as cystoid macular edema, glaucoma and cataracts. Unfortunately, providers often do not recognize the disease soon enough and have a difficult time identifying which patients require aggressive therapy.
Ophthalmologists need better therapeutic and diagnostic tools to identify uveitis patients with active disease and to determine when patients need earlier intervention. Most pharmaceutical trials in uveitis use ordinal scales of vitreous haze — an imperfect, subjective factor — as an outcome measure. Continuous measures of inflammation would provide more precise assessment of disease activity and improve our ability to differentiate activity. After all, uveitis is not just one disease. Inflammation occurs in many different areas of the eye and due to many different conditions (e.g., postoperative inflammation, corneal transplantation, glaucoma surgery), not just idiopathic uveitis.
To develop novel continuous automated measures of inflammation, several steps are needed. Over the past few years, our group at Cleveland Clinic Cole Eye Institute has developed software that allows semi-automated grading of imaging markers of inflammation. These images are obtained on commercially available platforms. We have worked to develop validated, reliable and reproducible metrics of ocular inflammation of the anterior and posterior segments.
Advertisement
Anterior segment optical coherence tomography (AS-OCT) can be used to identify cells in the anterior chamber (AC). We previously showed that quantification of AC cells using AS-OCT strongly correlated with clinical grading. AS-OCT identified cells at even clinical grade 0 and differentiated cellular counts even within a clinical grade. We also showed that the cells identified on OCT were inflammatory cells by performing AS-OCT quantification on animal models of uveitis. Our early work confirmed the feasibility of using AS-OCT to quickly identify and quantify AC activity.
To prove that this method was reliable and reproducible, we performed a prospective study of 643 eyes (presented at AAO 2018). To assess reliability, spectral-domain OCT (SD-OCT) imaging was performed and then repeated five minutes later either by the same imager or a different imager. We showed that both the intraclass and interclass correlation of our software and method was over 98%. Additionally, we determined that our software measuring tool was valid and responsive.
To further examine the validity of the AS-OCT software tool, we prospectively imaged patients after cataract surgery. (Surgery is the most common cause of inflammation, and the most common ophthalmic surgery is cataract surgery.) Our study (presented at ARVO 2019) again showed reliability and reproducibility. AS-OCT cellular counts improved with postop visits and at times identified inflammation when the clinician did not see any.
These studies indicate that AS-OCT is a robust tool that can quickly quantify AC inflammation. This method and software could have uses in many areas including screening for inflammation in patients with red eyes, screening for ocular complications in patients with juvenile idiopathic arthritis or other systemic diseases, and remote monitoring of patients with uveitis.
Advertisement
To measure posterior segment inflammation using imaging, there are several possible methods including:
Our group has developed software that allows calculation of all three of these metrics. In one of our first studies, we measured these metrics in 164 eyes with uveitis. We found active and inactive eyes had similar clinical and OCT vitreous haze scores. Central retinal thickness was 278 μm in active eyes and 265 μm in inactive eyes. Retina leakage area was 4.4% in active eyes and 0.9% in inactive eyes (P < 0.0001).
This early study confirmed that measuring retinal vascular leakage on widefield FA may be the most sensitive and specific way to measure posterior segment inflammation. OCT quantification of vitreous haze and retinal thickness also may be needed in some cases.
Our above studies have examined the use of these tools individually. In our Imaging Quantification of Inflammation (IQI) study, we evaluated them together, prospectively in uveitis patients.
Phase 1 of the IQI study was intended to correlate automated measures of intraocular inflammation to visual acuity and to assess the feasibility of following patients. In this prospective, observational case series, we enrolled patients with at least one eye with active intraocular inflammation and followed them for six months. At each visit, we conducted AS-OCT, SD-OCT macula and ultra-widefield FA.
Advertisement
With data from 28 patients (56 eyes) followed over a total of 117 visits, we found:
While our sample size was small, our data did indicate that OCT and FA are reliable automated imaging methods that correlate with visual acuity. They are feasible methods that can be used to follow patients and track their response to therapy, with minimal extra burden on the patient and physician.
In phase 2 of the study, we intended to measure the level of agreement between:
Advertisement
This phase evaluated 25 patients (50 eyes) over a total of 81 visits.
When comparing clinical exam (SUN criteria) alone with the gold standard of exam plus imaging, we saw a moderate kappa correlation of 0.63, with perfect agreement being 1.0. Although the specificity was 100% (because you would rarely call uveitis active based on clinical exam and then call it inactive based on imaging), the sensitivity was rather low at 56%.
More interesting, when comparing masked automated imaging with the gold standard of exam plus imaging, we saw a strong kappa correlation of 0.854. Imaging metrics had a sensitivity (detecting inflammation) of greater than 98%. The specificity of imaging metrics was 91%.
These excellent results indicate that masked imaging using our software is a sensitive and specific way to detect intraocular inflammation.

Image content: This image is available to view online.
View image online (https://assets.clevelandclinic.org/transform/b7afe3f4-6c67-4b40-b98a-2f90d0ebc037/semi-automated-quantification-vascular-a)
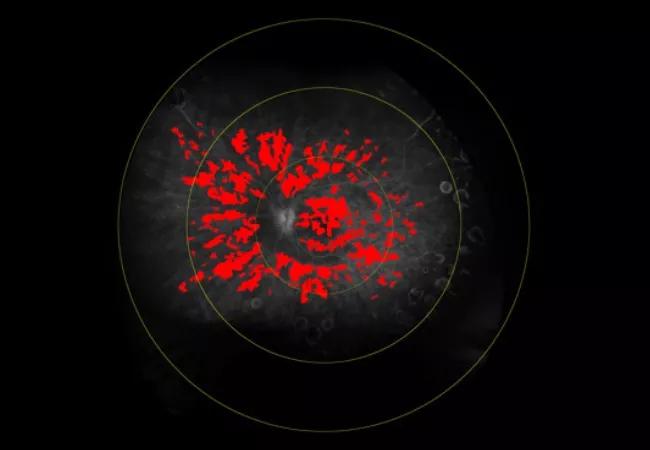
Figure 1. A patient presents with active disease. AC cell density is 36.41 cells/mm3. Central subfield thickness (CST) is normal. Total retinal leakage (total leakage index, TLI) is 19.5%.

Image content: This image is available to view online.
View image online (https://assets.clevelandclinic.org/transform/d60df4ab-20df-49d9-a5c8-c3f2d902bbea/semi-automated-quantification-vascular-b)
Figure 2. The patient is started on prednisone, adalimumab and topical steroid drops, and shows improvement. AC cell density decreases to 3.77 cells/mm3. CST stays the same. TLI decreases to 11.5%. While the disease appears inactive on clinical exam, leakage index indicates continued activity.

Image content: This image is available to view online.
View image online (https://assets.clevelandclinic.org/transform/84e2fc56-db09-4f00-a38a-0ccc540696d4/semi-automated-quantification-vascular-c)
Figure 3. After stopping use of steroids, AC imaging (19.07 cells/mm3) indicates worsening disease. TLI is better but still elevated at 9.5%. This indicates that imaging can reveal subtle disease activity requiring treatment.
These studies support the utility of continuous automated quantification of inflammation by imaging. Our next steps include assessing the risk of vision loss by imaging measures, implementing our measures in daily clinical practice, and eventually releasing our software for clinician use.
Imaging is an important tool in managing complex ocular inflammatory diseases (e.g., juvenile idiopathic arthritis, sarcoidosis, vasculitis). Continuous reliable measures of anterior and posterior segment inflammation can quickly be generated from common imaging modalities. Software advancements will help improve monitoring and may even support the development of therapeutics in uveitis. Using these tools, automated diagnosis, risk stratification and treatment assessment are feasible.
Drs. Srivastava, Lowder, Ehlers and Sharma are staff physicians at Cleveland Clinic Cole Eye Institute. Also at the Cole Eye Institute, Dr. Deaner was a uveitis fellow, Baynes is a research administrator, and Chen is a research student.
Advertisement

Prematurity is linked with poorer outcomes of retinal surgery in adulthood

Registry data highlight visual gains in patients with legal blindness

Study is first to show reduction in autoimmune disease with the common diabetes and obesity drugs

The advanced stage of diabetic retinopathy is among the most challenging for retinal surgeons

It’s the first step toward reliable screening with your smartphone

Fixational eye movement is similar in left and right eyes of people with normal vision

Oral medication may have potential to preserve vision and shrink tumors prior to surgery or radiation

A new online calculator can determine probability of melanoma